What is DataPav and how to use it
DataPav: Lightweight Column-Level Data Lineage for Python and SQL Pipelines
Overview
When refactoring complex analytical scripts or parsing legacy repositories, developers constantly face the same bottleneck: how to quickly trace the origin of a specific data attribute. Once a column passes through a sequence of joins, filters, renames, and custom transformations, its trail is easily lost in the codebase.
DataPav is a free, open-source tool built to visually map data pipelines and interactively track dependencies at the column level (column-level lineage).
Key Features
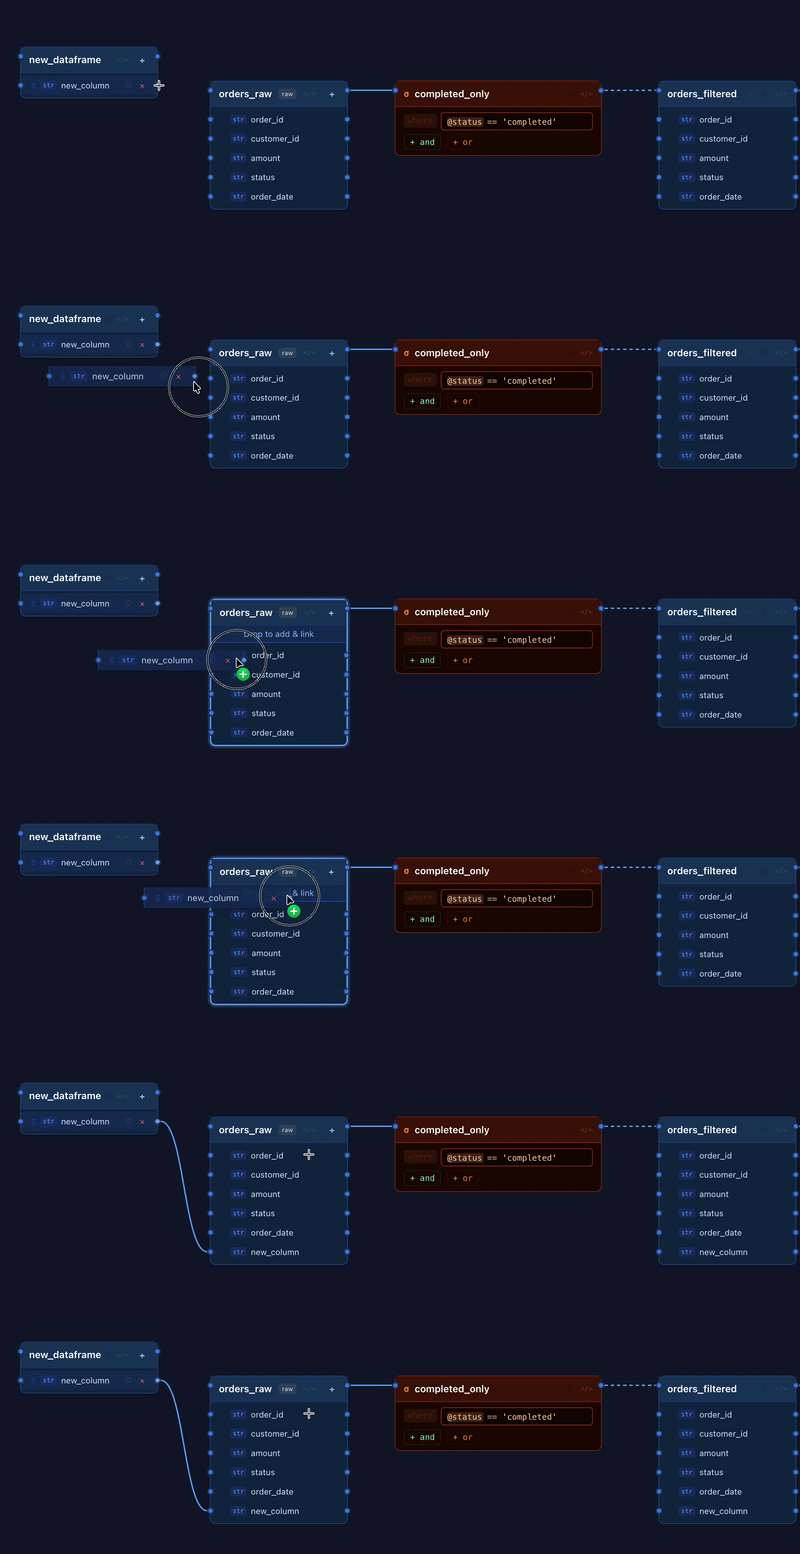
- Drag-and-Drop UI: Build, connect, and rearrange pipeline nodes seamlessly. Designed to eliminate the exhausting manual drawing overhead found in generic charting or diagramming tools.
-
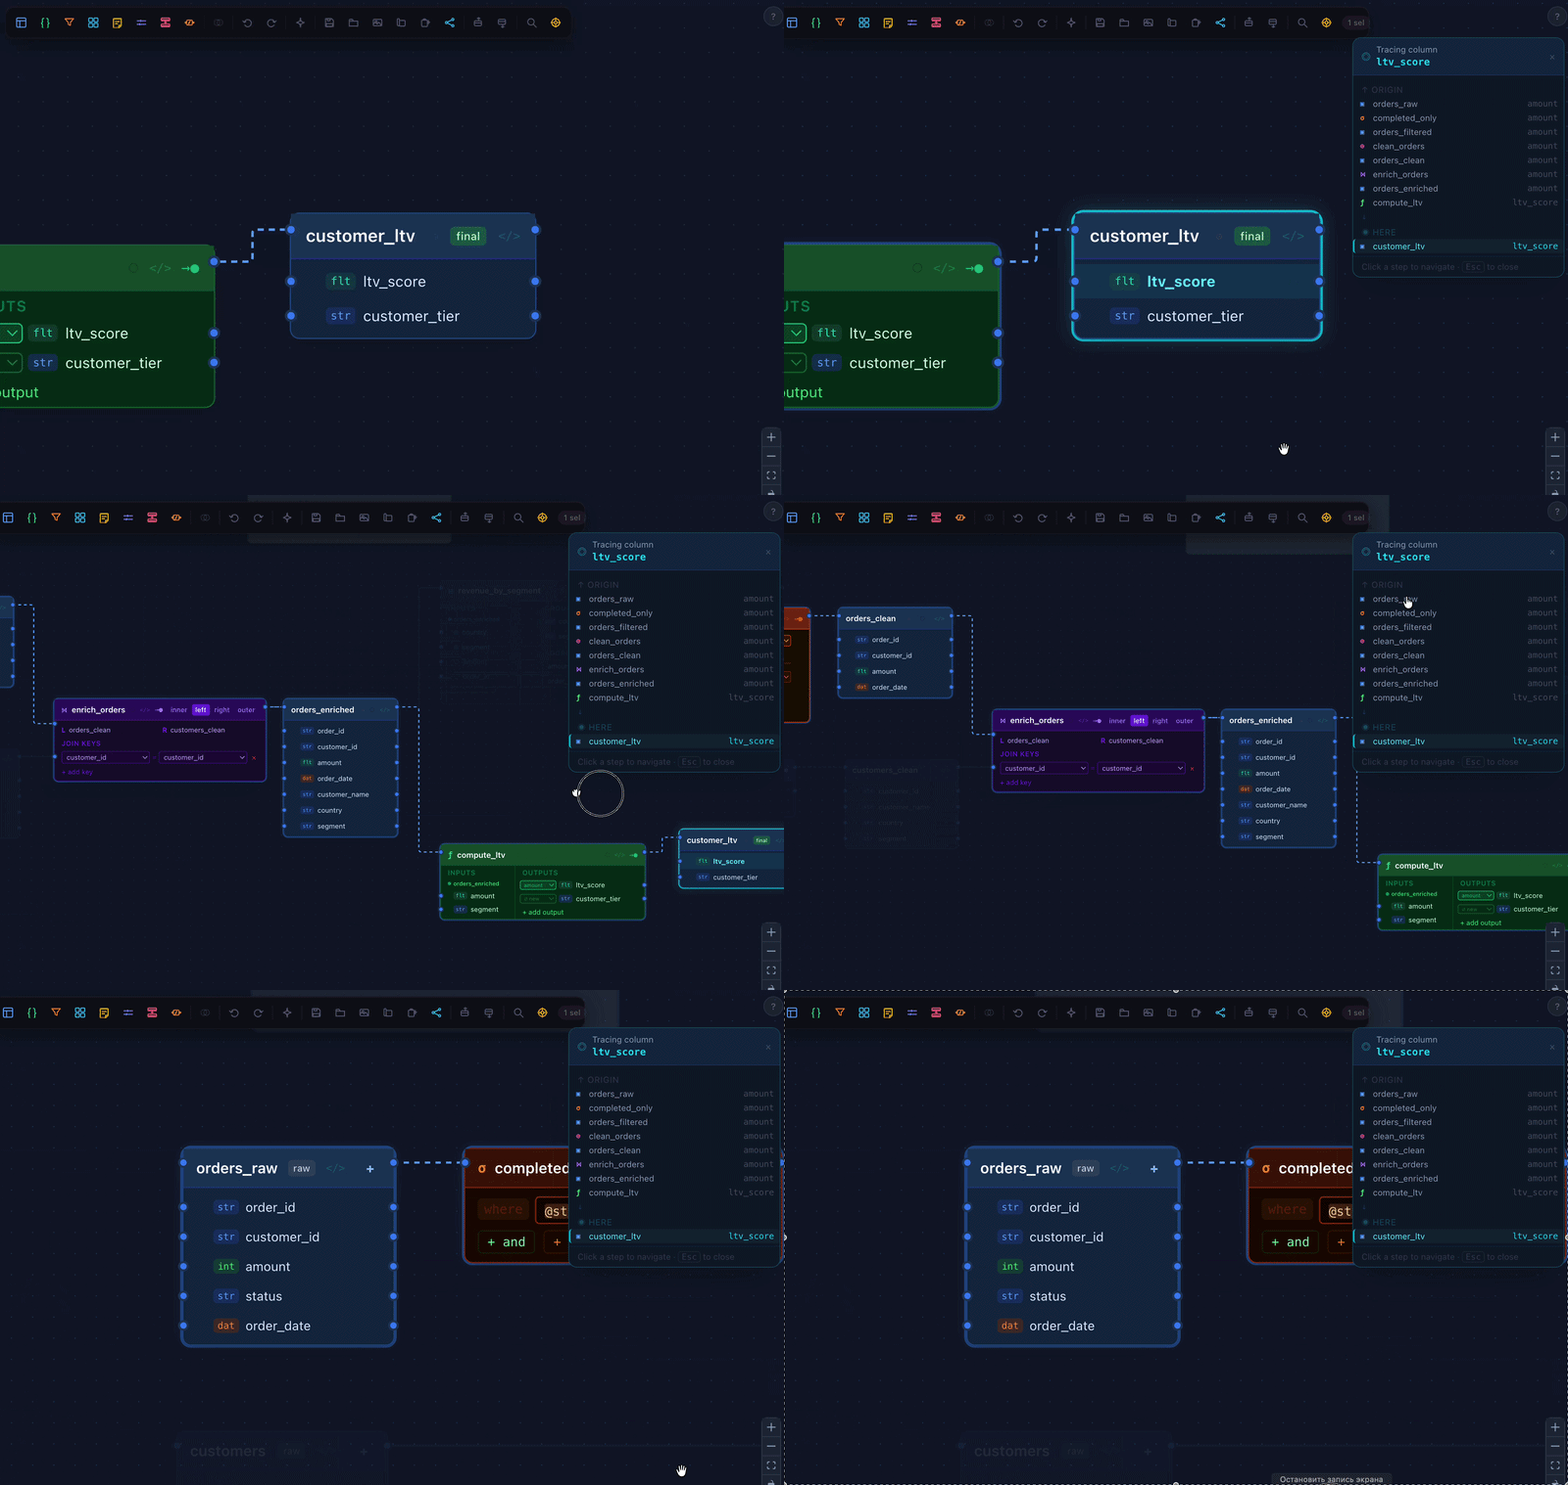
Interactive Lineage Tracking: Click any column in a final or intermediate data frame to instantly highlight its entire path back to the source, including all upstream renames and mutations.
-
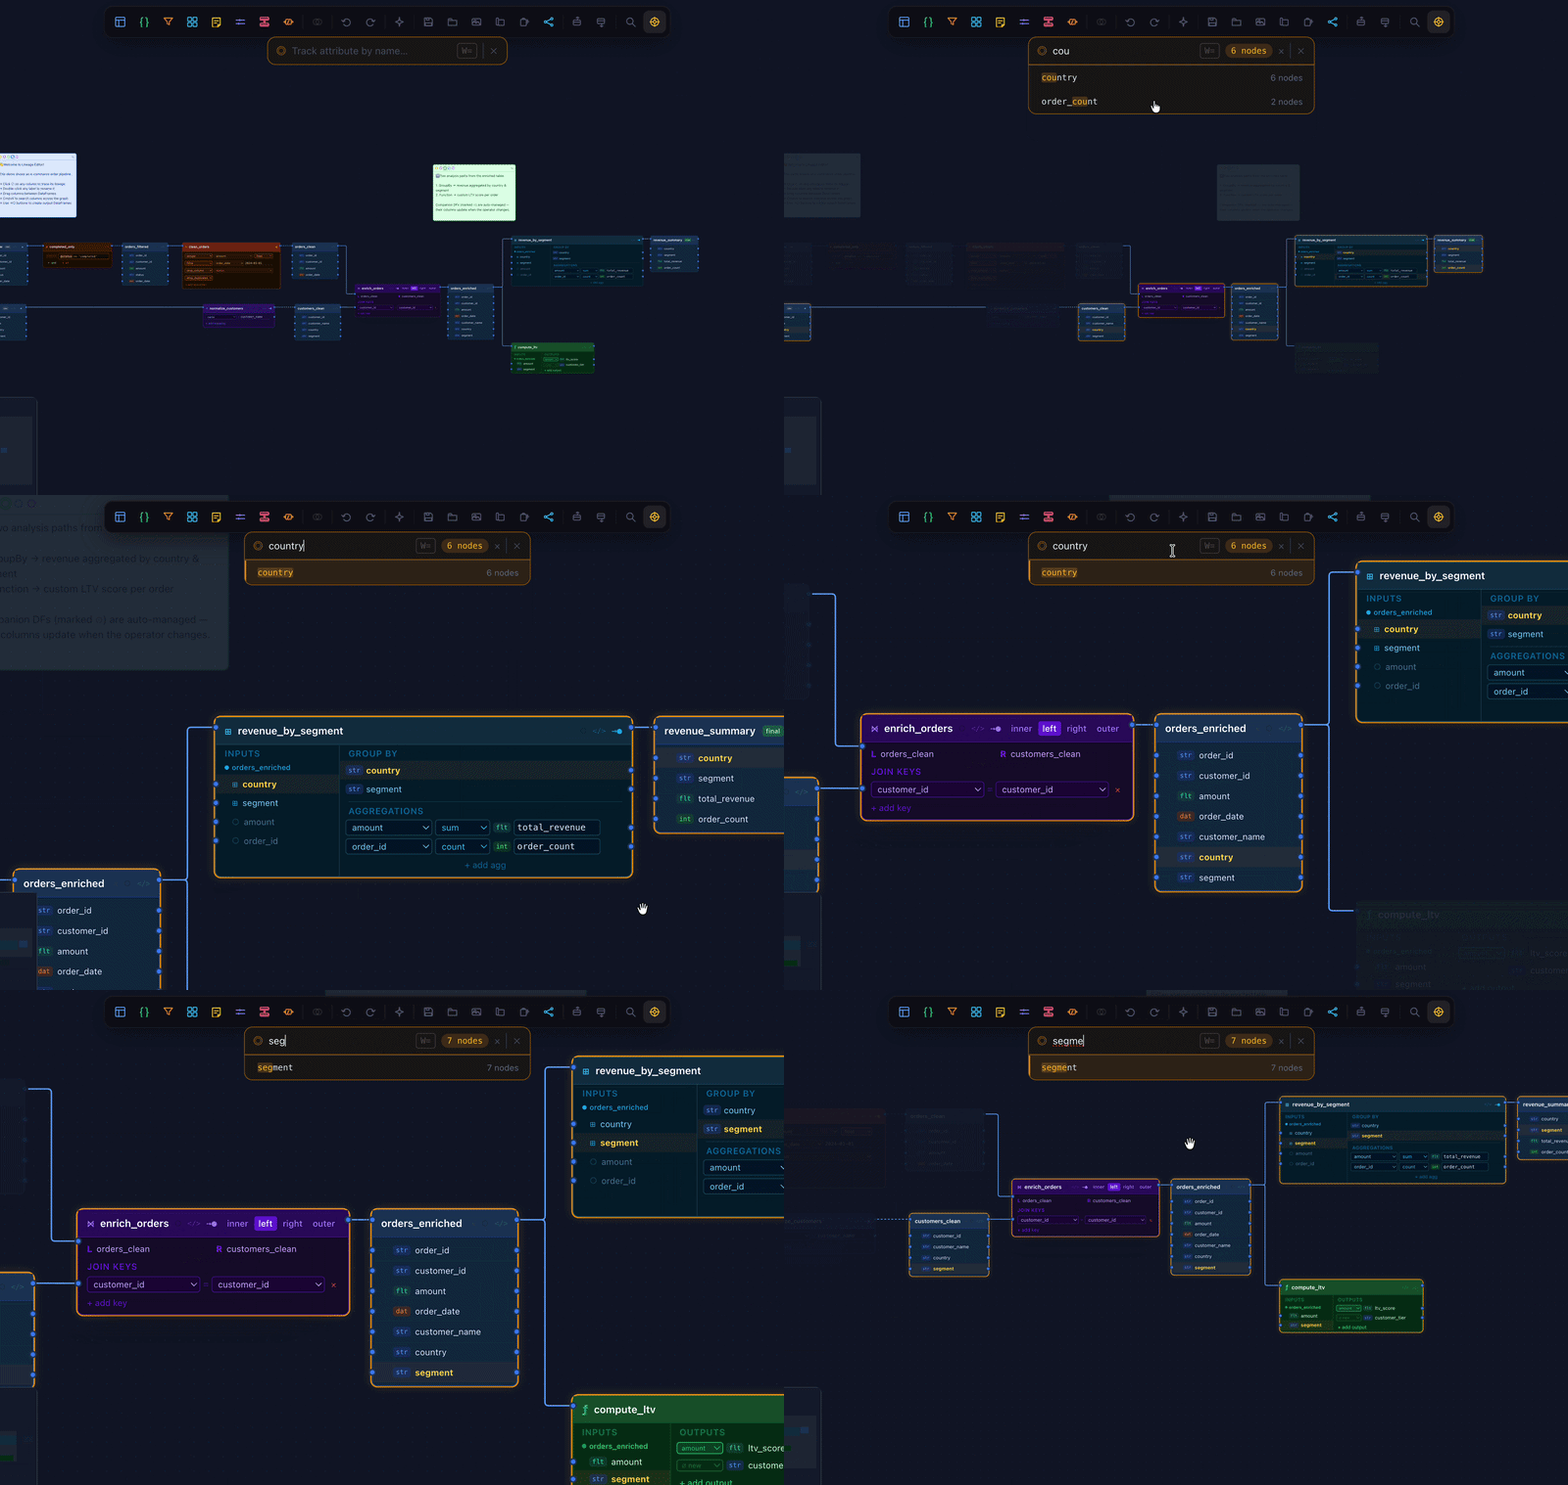
Instant Attribute Search: Quickly locate any column across the entire project. Type the column name into the global search to immediately pinpoint its position within massive, complex canvases.
-
Logical Pipeline Nodes: Built-in support for core data transformation operations: Data Frame, Condition Filter, Transform Column, Rename, Merge (Join), and Group By.
-
Privacy-First (100% Local): Runs entirely in your browser cache. No data is ever sent to external servers. Projects can be exported and imported as local JSON files, or run completely offline via npm and portable desktop builds. Note: because of that be careful before leaving the site
Practical Use Cases
1. Python Projects: Refactoring Pandas / Polars Spaghetti Code
In data science and analytics automation, scripts often grow into massive codeblocks where a single dataframe mutates sequentially across dozens of lines or functions.
- The Problem: You need to modify the calculation logic of a
user_segmentcolumn at the very beginning of a script. However, you don’t know where this column is dropped, renamed, or used to compute downstream metrics like LTV further down the file. - The DataPav Solution: Map the script’s core logic onto the canvas. Each processing step or function becomes a Transform or Custom Function node. Clicking on
user_segmentat the final output node instantly isolates its lineage graph, letting you refactor the code in your IDE without breaking downstream dependencies.
2. SQL Projects: Visualizing Complex CTEs and ETL Logic
When dealing with pure SQL pipelines, analysts frequently write queries spanning hundreds of lines with multiple Common Table Expressions (CTEs) and nested LEFT JOIN operations.
- The Problem: The final output of a massive query produces an adjusted metric like
revenue_adjusted. To figure out which source tables and specific coefficients it relies on, you have to manually parse the entire SQL script from bottom to top. - The DataPav Solution: Model the SQL query logic visually on the canvas. Use the Merge node to lock down Join keys and Condition nodes for
WHEREclauses. This outputs an interactive blueprint of your SQL logic where the origin of the final metric is visible at a single glance.
3. Code & Memory Optimization: Eliminating “Dead Weight” Columns
Carrying unused columns (e.g., massive string fields, temporary metadata, or redundant IDs) through an in-memory pipeline heavily bloats RAM usage and slows down processing time in Python frameworks like Pandas or Polars.
- The Problem: You suspect your script is wasting memory by dragging obsolete attributes across multiple functions, but manually checking whether a specific column is actually needed at the terminal step is tedious and prone to human error.
- The DataPav Solution: By tracing the lineage of any attribute from its starting node, you can instantly see if it ever reaches a crucial downstream aggregation, merge, or export. If the column leads to a dead end and just “hangs there,” you can safely introduce a
.drop(columns=[...])early in your code, optimizing the memory footprint and accelerating pipeline runtime.
Alternatives Comparison
While the metadata management market offers enterprise-grade lineage tools, DataPav occupies a specific niche as a lightweight “developer’s notepad.”
| Tool | Pros | Cons | When to choose DataPav? |
|---|---|---|---|
| Miro / Draw.io | Absolute freedom of drawing; familiar UI. | Static shapes. No built-in column-level logic. Updating a complex pipeline requires painful manual redrawing. | When you need an interactive trace between specific attributes, rather than just abstract boxes and arrows. |
| dbt docs | Automatically builds lineage from models; industry standard. | Hard-locked to the dbt ecosystem. Requires full project compilation and infra setup. Useless for ad-hoc Python/SQL scripts. | For projects built without dbt, or when you need to quickly sketch a refactoring plan without generating boilerplate YAML. |
| Enterprise Platforms (OpenLineage, Monte Carlo, etc.) | Full automation, data quality monitoring, automated DB log parsing. | Heavyweight, expensive, and complex to self-host. Requires production infrastructure integration. | When you need a zero-config tool right now on your local machine for daily dev tasks, without involving DevOps or security compliance. |
Conclusion
DataPav is not built to replace heavy enterprise data observability platforms. Its sole purpose is to offload the cognitive strain of reading, writing, and refactoring data-handling code. It acts as a digital canvas that natively understands columns, joins, and renames, helping engineers keep their data pipelines transparent.